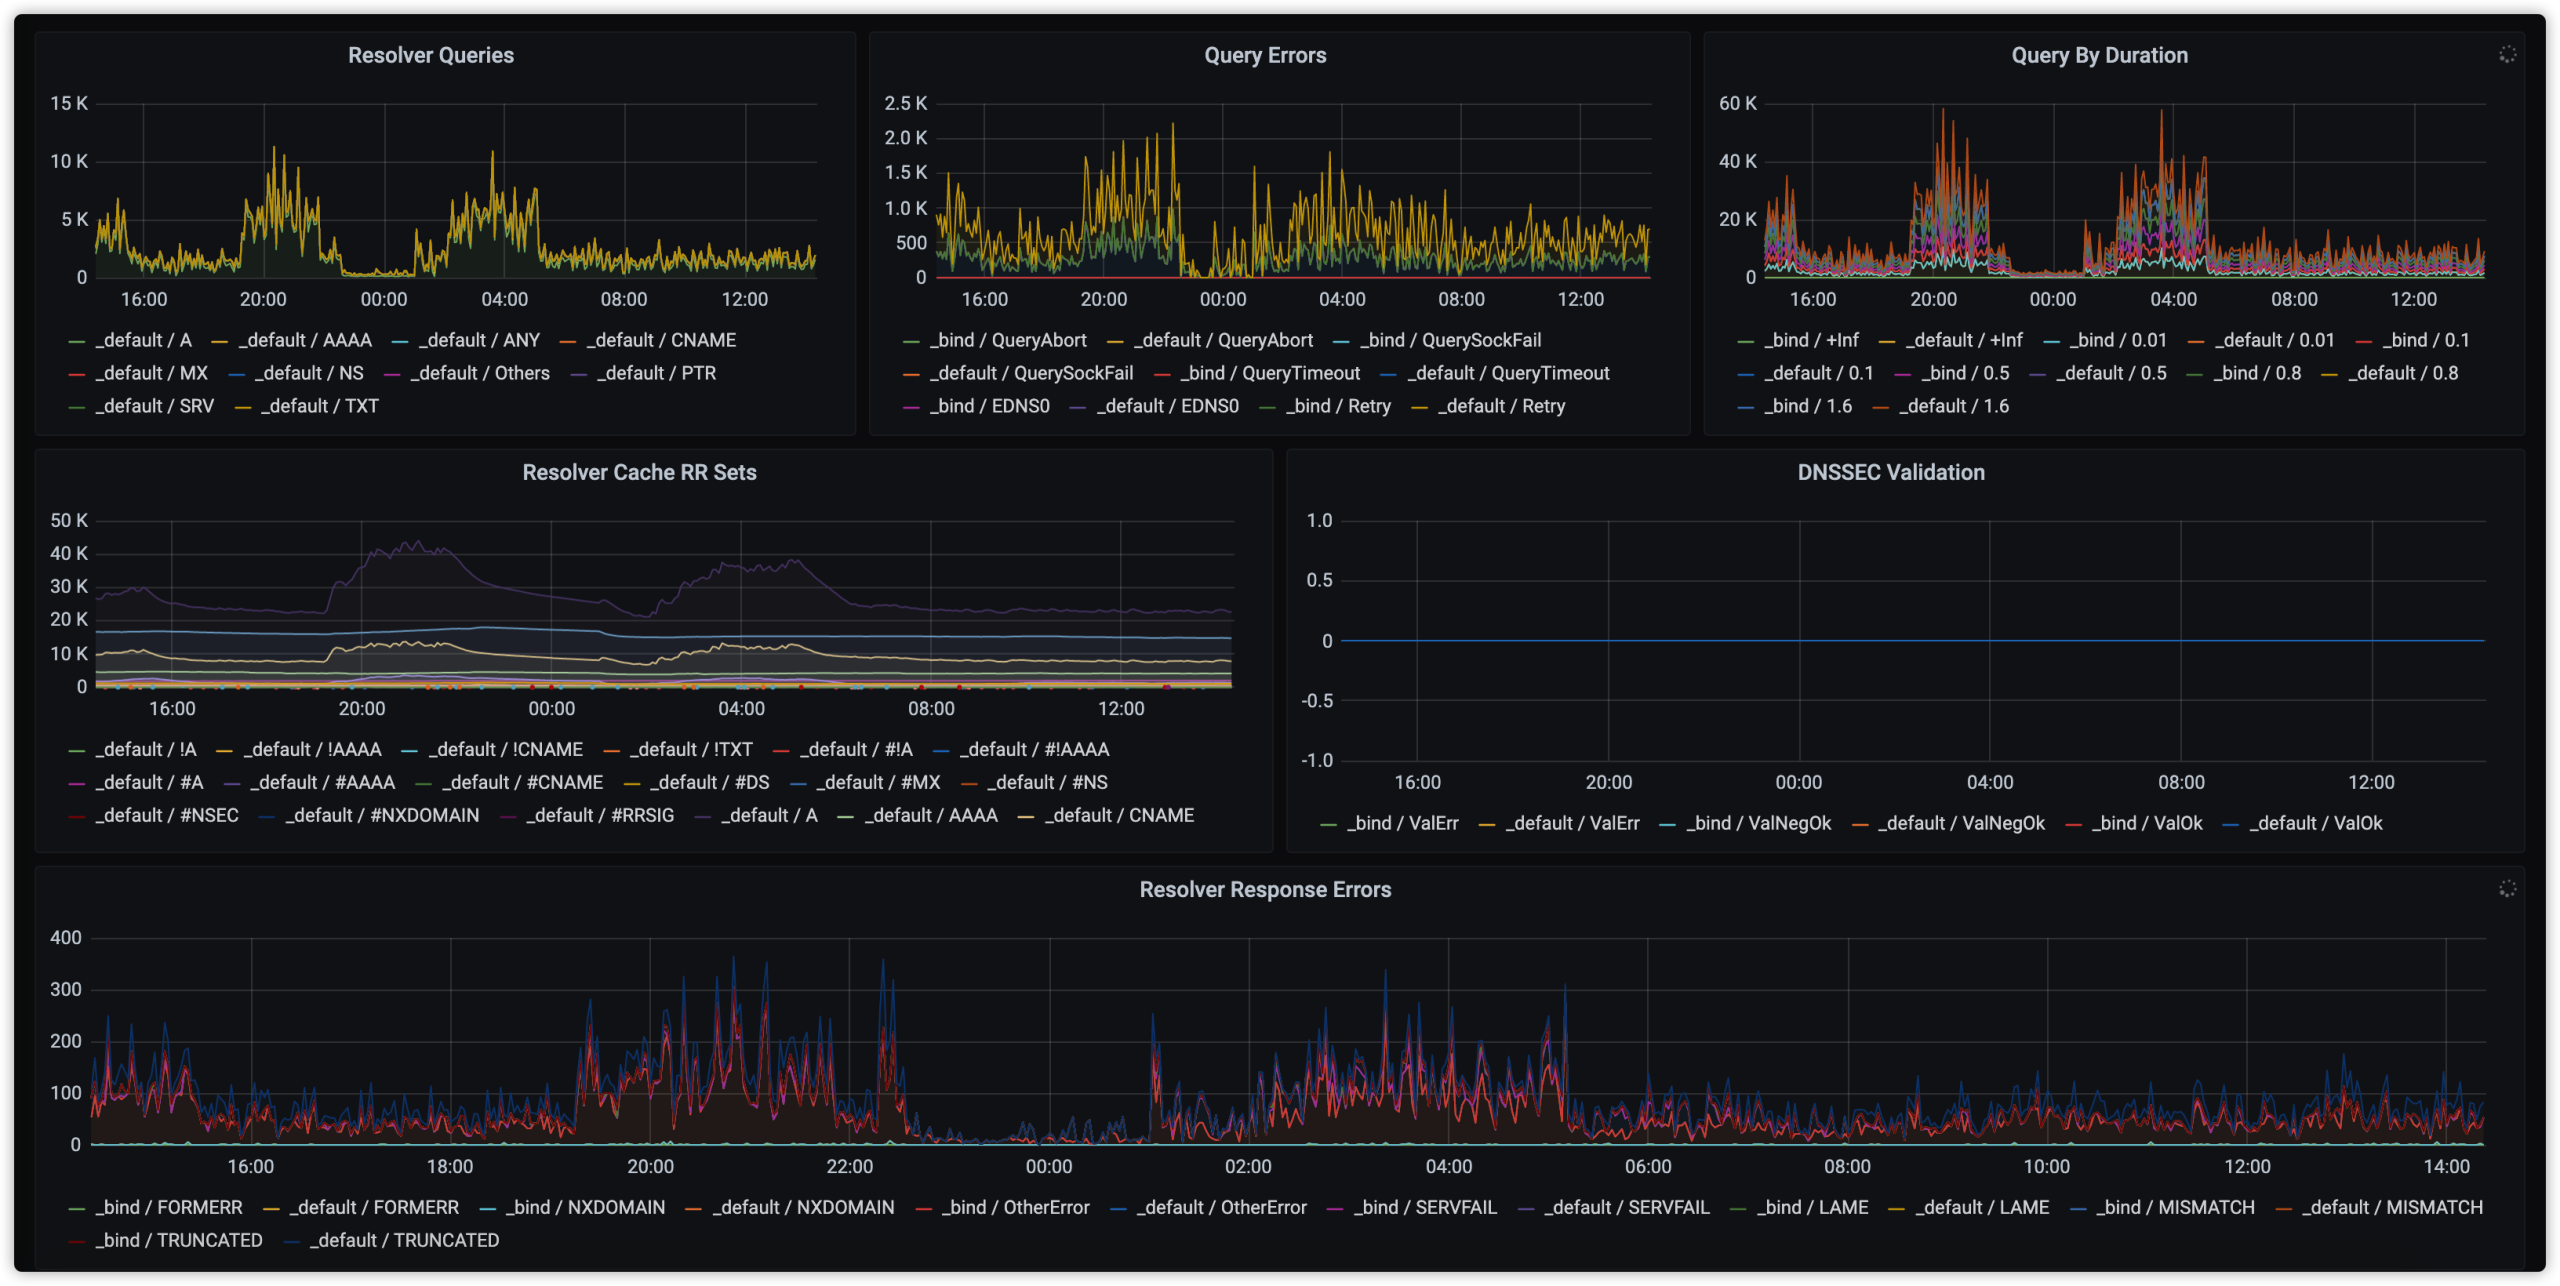
标签: prometheus

  • prometheus bind_exporter

    prometheus bind_exporter

    named.conf

    [root@aikaiyuan ~]# cat /etc/named.conf | more
    
    statistics-channels {
        inet 127.0.0.1 port 58053 allow { 127.0.0.1; };
    };
    

    bind_exporter

    https://github.com/prometheus-community/bind_exporter/releases

    [root@aikaiyuan ~]# wget https://github.com/prometheus-community/bind_exporter/releases/download/v0.3.0/bind_exporter-0.3.0.linux-amd64.tar.gz
    [root@aikaiyuan ~]# tar zxvf bind_exporter-0.3.0.linux-amd64.tar.gz
    [root@aikaiyuan ~]# cd bind_exporter-0.3.0.linux-amd64/
    [root@aikaiyuan bind_exporter-0.3.0.linux-amd64]#  ./bind_exporter -bind.stats-url="http://127.0.0.1:58053/" -web.listen-address="192.168.1.3:59100"
    
    • -bind.stats-url=”http://127.0.0.1:58053/” 指向 named.conf statistics-channels
    • -web.listen-address=”192.168.1.3:59100″ 监听本地端口, 由 Prometheus 调用

    Make sure BIND was built with libxml2 support. You can check with the following command: named -V | grep libxml2.

    Prometheus

    https://grafana.com/grafana/dashboards/12309

    [root@aikaiyuan ~]# cat prometheus.yml
      - job_name: 'dns'
        scrape_interval: 30s
        static_configs:
        - targets:
          - 192.168.1.3:59100
          labels:
            alias: localdns
    

    转载请注明:爱开源 » prometheus bind_exporter